Debug GitHub Actions in live CI environment with AI
A comprehensive guide to debugging GitHub Actions CI failures by SSH-ing into the live runner environment. Covers Tailscale (zero-config) and Cloudflare Tunnel (SSH key) approaches with step-by-step setup instructions. Uses Cursor as the IDE and AI assistants for real-time debugging.
The Problem
Debugging CI failures often devolves into a frustrating cycle: make a change, push, wait for the build, hit the next error, repeat. This happens because replicating the CI environment locally is difficult—or sometimes impossible when dealing with OAuth tokens, cloud IAM roles, or environment-specific configurations.
This guide shows you how to break that cycle by SSH-ing directly into your live CI environment when a job fails. You'll get full IDE access (with AI coding assistants) and an interactive terminal to diagnose and fix issues in real-time.
Supported IDEs
This guide uses Cursor. Any VS Code fork may work but alternatives have not been tested.
Prerequisites
- Remote-SSH extension installed in Cursor/VS Code
- A GitHub repository with Actions workflows
- For Tailscale method: A Tailscale account
- For SSH method: An SSH key pair and Cloudflare CLI
Method 1: Tailscale (Recommended)
Tailscale provides a zero-trust mesh VPN that eliminates SSH key management entirely. Authentication is handled through your identity provider, and devices on your tailnet can communicate directly without exposing ports to the public internet.
Why Tailscale?
No SSH keys to configure, rotate, or store in secrets. Keyless authentication via your identity provider. Ephemeral nodes auto-remove when the runner terminates.
Setup Tailscale
Create a Tailscale account
Sign up at login.tailscale.com/start. This creates your personal tailnet—a private mesh network for your devices.
Add your local machine to the tailnet
Follow the Tailscale device setup guide to install Tailscale on your development machine. Verify it appears in your admin dashboard.
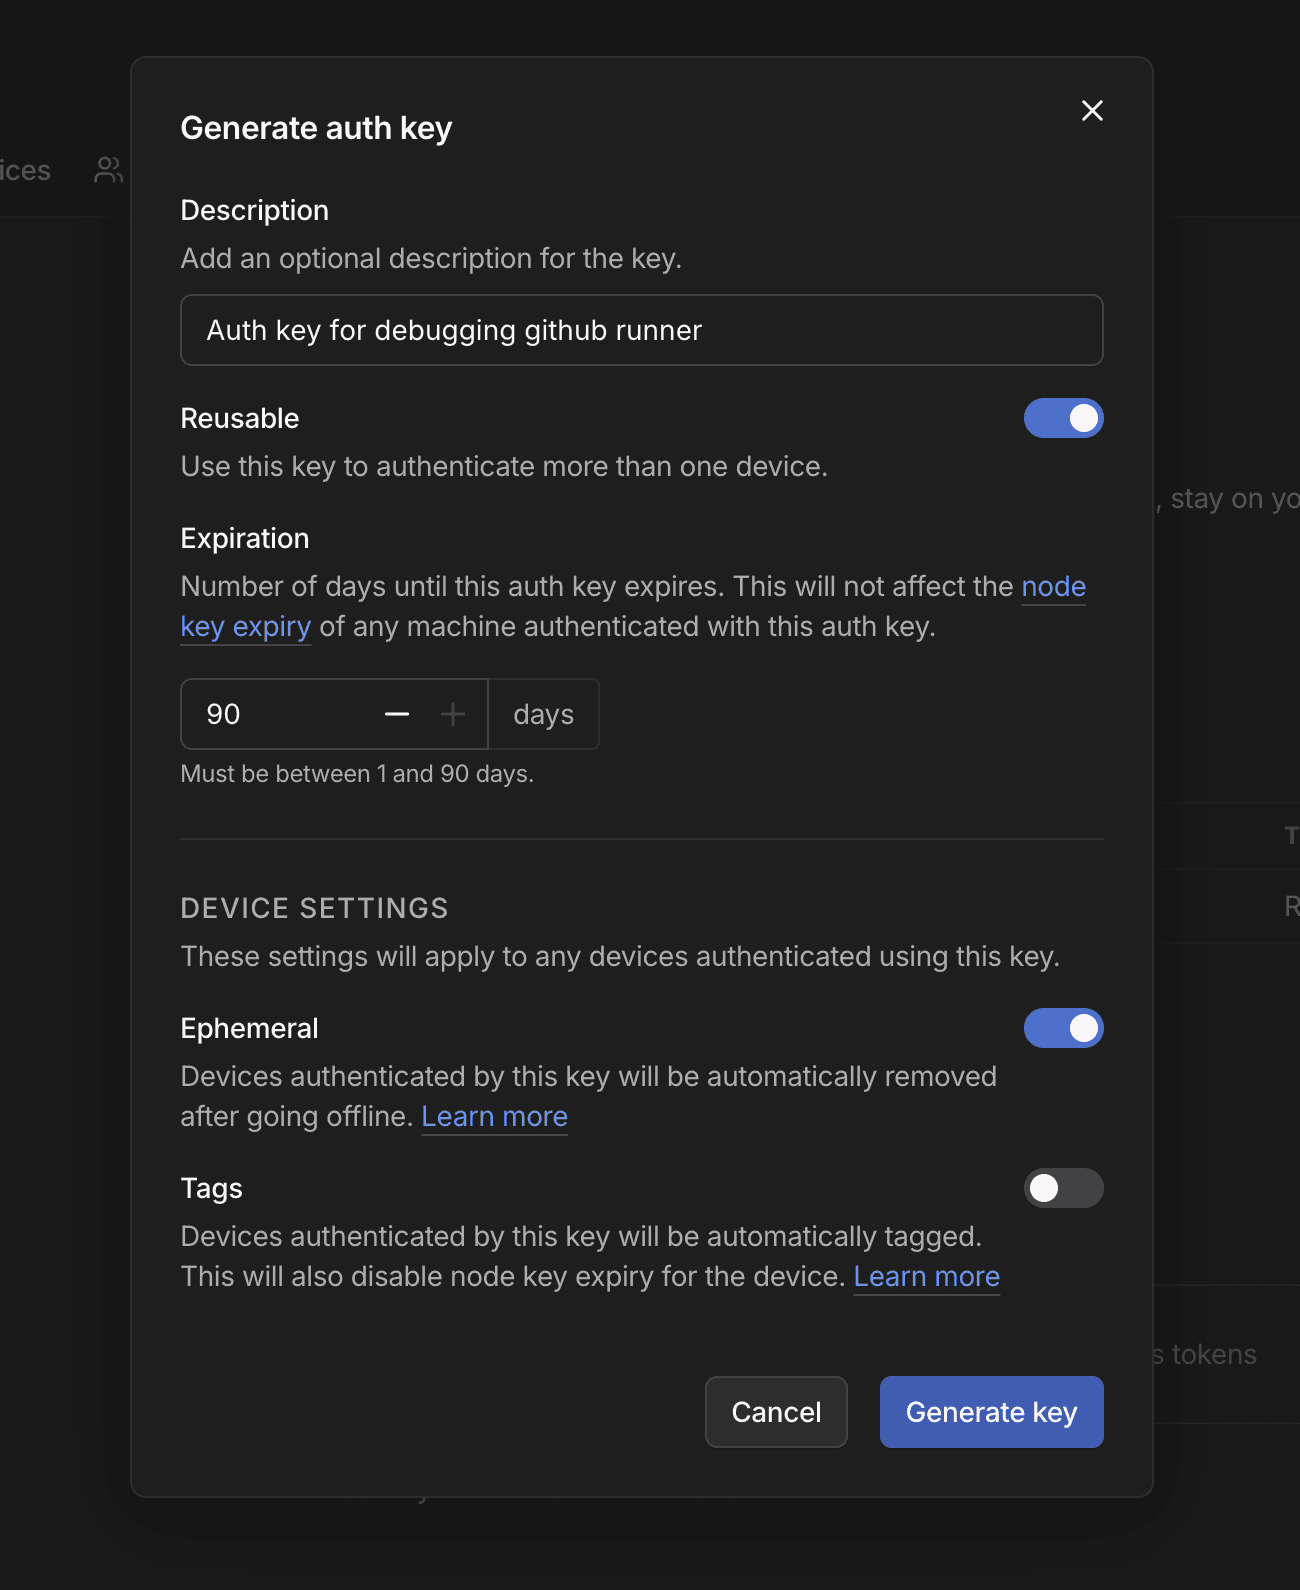
Generate an ephemeral auth key
Navigate to Settings → Personal Settings → Keys in the Tailscale admin console. Click Generate auth key with these options:
- Ephemeral: Enabled (auto-removes the device when disconnected)
- Reusable: Enabled (allows the same key for multiple runner registrations)
Add the auth key to GitHub Secrets
In your repository, go to Settings → Secrets and variables → Actions and create a new secret named TAILSCALE_AUTH_KEY_DEBUG with your generated auth key.
Configure the Workflow
Add this step to your workflow after the step that's failing. It connects the runner to your tailnet and keeps the job alive for debugging:
- name: Setup Tailscale SSH
  if: ${{ failure() }}
  run: |
    # Write secret to temp file
    mkdir -p /tmp/secrets
    echo "${{ secrets.TAILSCALE_AUTH_KEY_DEBUG }}" > /tmp/secrets/tailscale_auth_key
    chmod 600 /tmp/secrets/tailscale_auth_key

    # Install Tailscale
    curl -fsSL https://tailscale.com/install.sh | sh

    # Start Tailscale with auth key and SSH enabled
    sudo tailscale up --auth-key=$(cat /tmp/secrets/tailscale_auth_key) --hostname=gha-debug-${GITHUB_RUN_ID} --ssh

    # Get connection info
    TAILSCALE_IP=$(tailscale ip -4)
    TAILSCALE_HOSTNAME="gha-debug-${GITHUB_RUN_ID}"

    echo ""
    echo "========================================"
    echo "SSH INTO RUNNER"
    echo "========================================"
    echo "ssh runner@$TAILSCALE_IP"
    echo "ssh runner@$TAILSCALE_HOSTNAME"
    echo ""
    echo "OPEN IN CURSOR:"
    echo "cursor --folder-uri \"vscode-remote://ssh-remote+runner%40$TAILSCALE_IP/home/runner/work/\""
    echo "========================================"
    echo ""
    echo "(Keeping job alive; cancel the workflow when done debugging.)"
    tail -f /dev/null
Connect from Cursor
When the workflow fails, the step above logs a Cursor command. Copy and run it in your terminal:
cursor --folder-uri "vscode-remote://ssh-remote+runner%40100.88.xx.xx/home/runner/work/"Cursor opens directly to the runner's workspace. You now have full IDE access with integrated terminal and AI assistance.
Method 2: SSH with Cloudflare Tunnel
If you can't use Tailscale, this method uses traditional SSH keys with Cloudflare Tunnel to expose the runner's SSH port without a public IP.
Trade-offs
This approach requires managing SSH keys and updating your local SSH config for each debug session. It's more complex but works in environments where Tailscale isn't an option.
Setup SSH Keys
Generate an SSH key pair (if needed)
Check for existing keys with ls ~/.ssh. If you need a new key, generate one:
ssh-keygen -t ed25519 -C "github-actions-debug"See the GitHub SSH key guide for details.
Add the private key to GitHub Secrets
Create a secret named SSH_PRIVATE_KEY_DEBUG containing your private key (the file without the .pub extension).
Configure the Workflow
Add these steps after the failing step. They configure SSH and create a Cloudflare tunnel:
- name: Setup SSH private key
  if: ${{ failure() }}
  run: |
    mkdir -p ~/.ssh
    echo "${{ secrets.SSH_PRIVATE_KEY_DEBUG }}" > ~/.ssh/custom_key
    chmod 600 ~/.ssh/custom_key
    ssh-keygen -y -f ~/.ssh/custom_key > ~/.ssh/custom_key.pub
    chmod 644 ~/.ssh/custom_key.pub
    cat >> ~/.ssh/config << 'EOF'
    Host *
      IdentityFile ~/.ssh/custom_key
      AddKeysToAgent yes
    EOF
    chmod 600 ~/.ssh/config

- name: Start SSH session with Cloudflare Tunnel
  if: ${{ failure() }}
  uses: valeriangalliat/action-sshd-cloudflared@v1
Connect from Cursor
Clear any cached host keys
ssh-keygen -R action-sshd-cloudflaredConfigure the SSH proxy
Add a host entry to ~/.ssh/config using the hostname from the action output:
Host cf-gha
  HostName action-sshd-cloudflared
  User runner
  ProxyCommand cloudflared access tcp --hostname <hostname-from-action-output>
  StrictHostKeyChecking accept-new
Replace <hostname-from-action-output> with the Cloudflare hostname (e.g., facilities-canvas-frequency-reasonable.trycloudflare.com).
Open Cursor
cursor --folder-uri "vscode-remote://ssh-remote+cf-gha/home/runner/work/"Production Considerations
Finding Runner Logs
When debugging with AI assistants, you'll often want to feed them the full job logs. WarpBuild runners store logs at:
| Image | Log Location |
|---|---|
| Ubuntu x86-64 | /runner/_diag/*.log |
| Ubuntu ARM64 24.04 | /runner/_diag/*.log |
| Windows x86-64 | C:\warpbuilds\runner\_diag\*.log |
| macOS ARM64 | /Users/runner/.warpbuild/github-runner/runner-app-new/_diag/*.log |
Timeout and Notifications
Keeping a runner alive indefinitely burns CI minutes. Add a timeout and optional Slack notification for visibility:
- name: Notify on failure
  if: ${{ failure() }}
  uses: rtCamp/action-slack-notify@v2
  env:
    SLACK_WEBHOOK: ${{ secrets.SLACK_WEBHOOK }}

- name: Setup debug session
  if: ${{ failure() }}
  timeout-minutes: 30  # Auto-terminate after 30 minutes
  run: |
    # ... Tailscale or SSH setup from above
Cost awareness
GitHub Actions has a default job timeout of 6 hours. Without an explicit timeout-minutes, a forgotten debug session will continue burning minutes until it hits that limit.
See rtCamp/action-slack-notify for notification configuration and GitHub's timeout documentation for step timeout syntax.
WarpBuild: Faster CI, Faster Debugging
WarpBuild provides high-performance GitHub Actions runners with 10x faster job start times and built-in debugging features. Our runners include pre-configured log locations and optimized networking for seamless SSH access.
- Linux, Windows, and macOS runners across all major cloud providers
- 50-90% cost savings compared to GitHub-hosted runners
- Enterprise-ready with BYOC (Bring Your Own Cloud) support
Get started or book a demo to see how WarpBuild can accelerate your CI/CD pipeline.
Last updated on